
Available 24/7/365
Free Consultations
(800) 349-0000

In August 2023, residents of Plum Borough, Pennsylvania, were awakened by a thunderous explosion that leveled one home and damaged several others. The natural gas explosion killed six people and left a neighborhood in ruins. Investigators later determined that a pipeline leak had allowed gas to accumulate until it reached explosive concentrations. This tragic event shows the serious safety challenges facing America’s pipeline system.
The vast network of pipelines crisscrossing the United States serves as an essential but largely invisible infrastructure, transporting natural gas and hazardous liquids that power our economy by keeping industries running, supporting jobs, and maintaining daily life. When these pipelines fail, the consequences can range from minor leaks to catastrophic events with significant human, environmental, and economic impacts.
This analysis examines data from the U.S. Department of Transportation’s Pipeline and Hazardous Materials Safety Administration (PHMSA) spanning January 2011 to February 2025, providing a comprehensive review of pipeline safety incidents across the country.
Under federal regulations, pipeline operators must report incidents that meet specific safety and impact thresholds. These include events causing fatalities, serious injuries, significant property damage, substantial product loss, or environmental impacts. The PHMSA data provides a detailed record of these pipeline failures nationwide, capturing both catastrophic events and less severe but still significant incidents.
Our investigation analyzes this extensive dataset to identify patterns and trends in America’s pipeline infrastructure on national, state and county levels. The findings presented here offer important insights for policymakers, industry stakeholders, safety advocates, and communities living near these essential but potentially hazardous transportation systems.
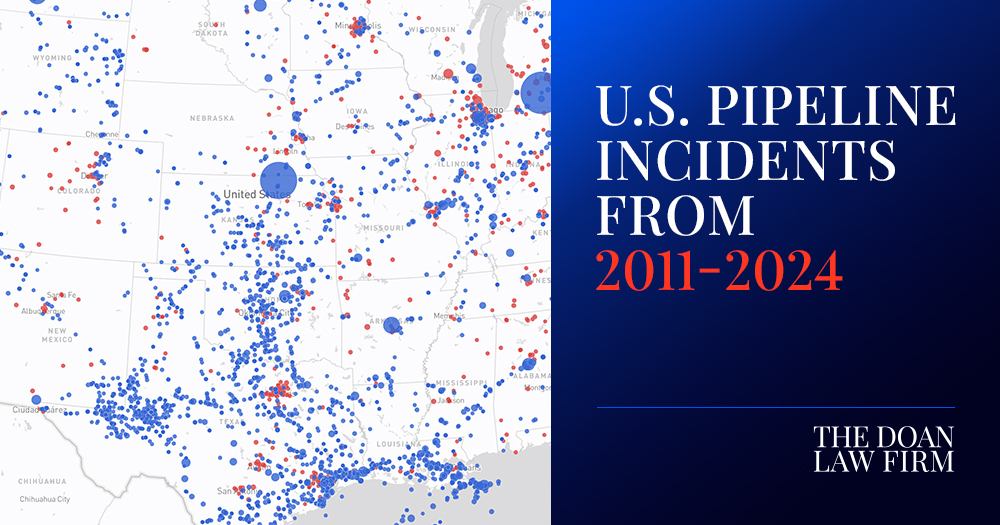
Since 2011, there have been over 7,000 pipeline incidents reported to the PHMSA, 5,546 involving hazardous liquids like crude oil and 1,498 involving natural gas. The map below shows where each incident occurred, followed by a chart displaying the top states by number of combined incident types.
*the map above is interactive. If viewing on a mobile device, rotate device for best viewing experience.
Texas reported the highest number of hazardous liquid incidents in the country, with 2,267 incidents recorded during the study period. This figure reflects the scale and concentration of pipeline infrastructure in the state.
California had the highest number of gas distribution incidents (177) and also reported 279 hazardous liquid incidents. Other states with notable counts of hazardous liquid incidents include Oklahoma (446), Louisiana (344), Kansas (233), and Illinois (202).
The choropleth map below illustrates how pipeline incidents are distributed across U.S. counties, with darker shades representing higher incident counts, while the chart provides a breakdown incidents by pipeline incident type for the counties with the highest combined total.
*the map above is interactive. If viewing on a mobile device, rotate device for best viewing experience.
Harris County, Texas leads the nation by a wide margin, with 16 gas distribution incidents and 411 hazardous liquid incidents. This high total likely reflects the county’s key role in the energy sector. As home to Houston, Harris County contains a dense network of pipelines, refineries, energy company headquarters, and the Port of Houston. Together, these make it one of the most important hubs for fuel transportation and processing in the country. Other Texas counties also rank high, including Jefferson County (231 hazardous liquid incidents), Midland County (147), and Nueces County (57), which points to the state’s widespread energy infrastructure.
Outside Texas, Los Angeles County, California stands out with 35 gas distribution incidents and 112 hazardous liquid incidents. It had the highest number of gas-related incidents among all counties, showing the risks that come with highly populated urban areas. Payne County, Oklahoma and Kern County, California also reported high numbers of hazardous liquid incidents, with 101 and 80 respectively. Middlesex County, New Jersey is the only Northeast county to appear in the top ranks, with 82 combined incidents.
In the sections that follow, we further detail each type of pipeline incident, highlight key trends, and explore the reports that stand out.
Among the various types of pipeline systems recorded in the PHMSA dataset, gas distribution systems stand out due to their direct connection to homes, schools, and businesses in communities across the country. These pipelines represent the final stage of the delivery network, operating at lower pressures than long-distance transmission lines but running beneath densely populated neighborhoods — making failures especially dangerous.
A gas distribution incident, as defined by federal regulations in 49 CFR Part 191, must be reported if it results in a fatality, a hospitalization, property damage of $122,000 or more (excluding the value of lost gas), or the unintentional release of at least three million cubic feet of gas. Distribution incidents may also be reportable if they cause emergency service disruptions or meet other criteria deemed significant by operators. The PHMSA requires prompt reporting, within one hour of confirmation, and a detailed follow-up within 48 hours to ensure timely investigation and mitigation.
The summary table below provides a comprehensive overview of gas distribution incident frequency, along with their consequences such as injuries, fatalities, and associated costs. It offers insight into both the severity and the financial impact of these events.
As previously mentioned, California reported the highest number of gas distribution incidents, with 177. Texas, New York, and Michigan also recorded high counts, each exceeding 100 incidents.
Explosions were a factor in 337 gas distribution pipeline incidents, accounting for roughly 22 percent of all cases. Compared to hazardous liquid incidents, gas distribution events are more likely to result in injuries, likely due to the increased risk of explosions and fires. Since 2011, New York has experienced the most explosions with 37, followed by Texas (28) and California (24).
Nationally, about 1 in 5 gas distribution incidents results in an injury. In Texas, that rate is significantly higher, with nearly 1 in 3 incidents leading to injury.
Some states, despite reporting relatively few incidents, experienced a high proportion of harmful outcomes. In Louisiana, half of the state’s 18 incidents resulted in injuries, and four involved fatalities, giving it one of the highest fatality shares in the country. Tennessee showed a similar pattern: over 40% of its 24 incidents resulted in injury, and four involved a loss of life.
Some states experienced a disproportionate financial impact. Massachusetts reported $1.6 billion in total costs — the highest of any state — even though it saw fewer than 35 incidents. The 2018 overpressurization of Columbia Gas’s distribution system in Massachusetts, was the costliest gas incident on record.
Connecticut had the highest median estimated cost, despite having one of the lowest number of incidents overall. This was driven by two particularly costly events: a fire caused by the accidental cutting of an active pipe during a building renovation ($757,836) and damage from excessive rooftop snow removal that cracked a gas meter connection ($501,920).
While the impact of these incidents varies significantly by state, understanding what causes them is essential to preventing future harm and reducing risk across the gas distribution system.
Gas distribution incidents can stem from a variety of causes. The most common cause is excavation damage by third parties, which accounts for 443 incidents. This incident type also had one of the highest costs overall. This often occurs when unauthorized digging or construction activities inadvertently damage gas pipelines. Whether from road repairs, utility installations, or other excavation projects, these incidents frequently lead to dangerous leaks or explosions.
While not among the top ten, overpressured pipelines had the highest overall cost, mainly because of the $1.6 billion incident from Massachusetts. Although earth movement accounted for only 11 incidents and did not rank among the top ten causes, it had the highest median estimated cost and was the fourth-leading cause of total injuries.
Another significant cause is damage by non-excavation motorized vehicle/equipment, which contributed to 205 incidents. This occurs when vehicles or heavy equipment strike above-ground pipelines or other infrastructure, causing ruptures or leaks.
In some cases, nearby fires or explosions, whether industrial, man-made, or natural, have a direct impact on gas distribution systems, leading to 90 incidents. The heat or blast from these external events can weaken or rupture pipelines. Electrical arcing from other equipment or facilities (43 incidents) also poses a risk, as electrical surges or sparks from equipment can ignite gas leaks, causing fires or explosions. While damage from third-party excavations is the most prevalent, incidents also arise from excavation damage by the operator’s contractor (35 incidents), which refers to damage caused by contractors working under the gas distribution operator’s direction. Despite being authorized, improper precautions during digging can still lead to significant damage.
The following incidents are notable for their high injury counts, with details on what caused them, when and where they occurred.
On March 12, 2014, at approximately 9:31 a.m., two five-story multi-use buildings located at 1644 and 1646 Park Avenue in New York City were destroyed by a devastating explosion and subsequent fire. The buildings, situated on the west side of Park Avenue between East 116th and East 117th Streets, collapsed as a result of the blast. Tragically, eight people were killed and approximately 48 others were injured.
Con Edison received a gas odor report at 9:13 a.m. from a nearby address and dispatched a gas mechanic by 9:15. Minutes later, reports of an explosion and building collapse came in. Crews arrived by 9:40 a.m. and confirmed the destruction. Con Edison personnel responded with excavations and shut down a leaking gas main on Park Avenue between East 116th and 117th Streets. A street collapse and water main break followed around 1:44 p.m., accompanied by a strong gas odor.
The NTSB investigation found the cause to be a failed fusion joint on a gas service tee installed by Con Edison in 2011, which allowed gas to leak and ignite. A long-unrepaired sewer breach, which caused soil erosion and weakened utility lines, contributed to the failure.
On August 10, 2016, an explosion and fire destroyed the building at 8701 Arliss Street in Silver Spring, Maryland, killing seven people and injuring more than 65 others.
The NTSB concluded the likely cause was the failure of an indoor mercury service regulator, which allowed natural gas to escape and ignite. Washington Gas disagreed, citing multiple potential gas sources and stating the exact cause remains undetermined. Nonetheless, the company implemented all NTSB safety recommendations, including an expedited program to remove remaining mercury service regulators. The Maryland Public Service Commission approved the plan on December 18, 2020.
On September 13, 2018, a major gas distribution failure occurred in Lawrence, Andover, and North Andover, Massachusetts, when Columbia Gas of Massachusetts overpressurized its low-pressure system. The incident led to dozens of fires and explosions across the three towns.
The disaster resulted in one fatality and at least 25 injuries. Hundreds of buildings were damaged or destroyed, and thousands of residents were forced to evacuate. All gas valves were shut down by 7:24 p.m., though gas continued to bleed through the system until the following morning.
The NTSB investigation concluded that the probable cause was Columbia Gas’s failure to account for critical pressure-sensing lines during a construction project. In response, regulatory and industry changes were implemented to improve safety on low-pressure gas systems.
On August 25, 2012, an explosion occurred at 453 Worthington Street in Springfield, Massachusetts. A gas company employee responding to an odor complaint punctured a service line while probing outside the building, causing natural gas to leak and enter the structure.
The released gas ignited and triggered a powerful explosion, injuring 17 people and damaging multiple nearby buildings.
On March 4, 2014, a contractor struck a gas line at 28 Crockett Lane in Ewing, New Jersey. While gas crews were investigating the damage, an explosion occurred at 12:52 p.m., followed by a fire. Several homes on Crockett Lane and Pioneer Court were destroyed or severely damaged. One resident, Linda Cerritelli, was killed, and ten workers from Public Service Electric & Gas and Henkels & McCoy sustained non-life-threatening injuries.
Hazardous liquid pipelines are responsible for transporting substances such as crude oil, gasoline, diesel, jet fuel, and other refined products. These pipelines span thousands of miles across the United States, often running through rural, agricultural, and environmentally sensitive areas. While less likely to run directly beneath residential neighborhoods compared to gas distribution lines, failures in hazardous liquid pipelines can result in large-scale environmental damage, costly cleanups, and major disruptions to energy supply chains.
According to federal regulations in 49 CFR Part 195, a hazardous liquid pipeline incident is considered reportable if it results in a fatality or injury requiring hospitalization, involves the release of five or more barrels of product, causes property damage exceeding $50,000, or leads to an unintentional fire or explosion. Operators must report these incidents promptly and provide detailed follow-up information to the PHMSA. The consequences of these events can be far-reaching, especially when spills contaminate waterways, threaten drinking water sources, or impact ecologically sensitive regions.
To understand the scope and impact of these incidents at the state level, the following table provides a breakdown of hazardous liquid pipeline incidents, including injury and fatality rates, as well as associated financial costs.
Compared to gas-related events, hazardous liquid incidents were far less likely to result in injury or death, even in states with high incident counts.
Texas recorded the highest number of hazardous liquid incidents by a wide margin, yet injuries were reported in just 32 of those events (1.4%), and only 8 resulted in fatalities. Its fatality share of 0.18% was among the lowest in the dataset, suggesting that while Texas faces frequent disruptions, most are non-lethal. Still, the financial cost was immense: over $480 million in total damages.
Some states, however, experienced fewer incidents with relatively higher human impact. Georgia and Nebraska both had one fatal and one nonfatal injury, despite only logging 33 and 35 incidents, respectively. These states had the highest fatality and injury shares at nearly 3%.
Several states with significant incident totals saw no injuries or fatalities at all. California had 279 incidents with no reported harm, followed by Louisiana (344), Kansas (233), and Oklahoma (446).
Michigan stood out due to the financial toll of its incidents: the state reported only 64 events but incurred over $892 million in total damages, the second-highest figure in the country. This outsized cost is largely attributed to a single catastrophic event in 2010, when an oil pipeline ruptured in Calhoun County, releasing more than 800,000 gallons of crude oil into the Kalamazoo River system.
Idaho, with just 11 incidents, had a notably high median cost of $222,064. A similar pattern appeared in Nebraska, where 35 incidents resulted in a median cost of $152,005.
Most other states reported no injuries or deaths at all, including high-population areas like New Jersey and Illinois, as well as more rural states like Montana and North Dakota. In fact, 38 states experienced no hazardous liquid fatalities whatsoever.
On average, across all states with more than 10 incidents, 13% of all incidents involved water contamination or had an impact on wildlife. Specifically, 482 incidents involved water contamination, wildlife impact or both. These incidents accounted for 76% of the total estimated cost of all incidents and included the most costly incidents on record. Below we’ve visualized these incidents by year, release volume and commodity type.
Crude oil was the leading commodity involved in hazardous liquid incidents, both in frequency and in the volume released. Across all recorded incidents, over 1.7 million barrels of crude oil were spilled. Refined petroleum products also accounted for a large number of cases and substantial release volumes.
To better understand these spills, it’s important to look at what causes hazardous liquid incidents in the first place.
The chart below outlines the ten most common causes of hazardous liquid incidents.
The top causes of hazardous liquid incidents highlight a combination of material degradation, mechanical failures, and operational errors. Internal corrosion emerged as the leading cause, responsible for 765 incidents. This occurs when corrosive substances within the pipeline, such as water or contaminants, degrade the internal surfaces over time, potentially leading to leaks or ruptures. Non-threaded connection failures, which accounted for 694 incidents, typically involve welded or flanged joints. Failures in these connections may result from fatigue, improper installation, or deterioration under pressure.
Pump or pump-related equipment was cited in 555 incidents, reflecting the critical role this machinery plays in maintaining flow within hazardous liquid systems. Failures in these systems can disrupt operations and cause substantial spills. External corrosion, the fourth most common cause with 438 incidents, involves the degradation of pipeline exteriors due to environmental exposure, especially in areas with poor protective coatings or insufficient cathodic protection.
Together, these top causes stress the importance of corrosion management, equipment reliability, and strict adherence to operational protocols in preventing hazardous liquid incidents.
Below, we’ve outlined some of the most voluminous hazardous liquid incidents.
On August 14, 2020, Colonial Pipeline was alerted by a local resident to a possible gasoline leak near Huntersville-Concord Road in North Carolina. Utility vehicle riders had noticed signs of a release along a trail crossing the pipeline’s right-of-way. A Colonial employee confirmed the leak later that evening, prompting an immediate shutdown of two pipeline lines and a full emergency response.
The source was traced to a faulty sleeve repair from 2004 on Line 1. Repairs were completed and Line 1 was restarted five days later. The incident, believed to have occurred in late July 2020, resulted in significant environmental response efforts and multiple agency notifications. The spill led to confirmed contamination of soil and groundwater, as well as reported impacts on local wildlife. The estimated release volume is 47,619 barrels. This incident accounted for the largest release in our study.
On July 26, 2010, Enbridge confirmed a rupture on Line 6B near Marshall, Michigan, at milepost 608.2452. The failure occurred during a scheduled pipeline shutdown, delaying immediate detection. Once discovered, operations were halted under a Corrective Action Order from PHMSA, and the line remained shut down until Enbridge completed mandated safety measures. The pipeline was restarted on September 27, 2010.
The release was initially estimated at 19,500 barrels of crude oil, with an undetermined amount entering Talmadge Creek and ultimately the Kalamazoo River. The spill caused soil contamination, water contamination, and measurable wildlife impacts. While no drinking water sources were confirmed to be contaminated at the time, assessments continued in partnership with state and local health officials.
The failed pipe section was sent for metallurgical analysis under NTSB oversight. Enbridge estimated total costs between $300 million and $400 million, covering emergency response, environmental cleanup, pipeline repairs, and third-party claims. Investigations by Enbridge, PHMSA, and the NTSB remained ongoing.
On August 12, 2013, at 23:16, Willow Station experienced a drop in suction pressure, prompting a controller to suspect a leak. The Iowa station operator was immediately notified to shut down the pumps. Local personnel were put on standby once the leak location was confirmed. At 23:58, a farmer reported a fire near Aerial Marker (AM) 76 / Milepost (MP) 16, prompting a response from operations personnel.
A 1-mile safety buffer was established, and all homes within the zone were evacuated. At 02:35 on August 13, 2013, local personnel closed the block valve at AM 76 / MP 16, isolating the leaking segment. Affected pipe was cut out and sent for metallurgical analysis, and the pipeline was returned to service on August 17, 2013.
Soil contamination was assessed with 14 samples, one of which showed benzene levels within regulatory standards, although the source of this contamination was inconclusive. Groundwater testing revealed elevated BTEX levels above regulatory standards, but its link to the release remains unconfirmed.
Metallurgical analysis identified the rupture’s cause as a defect in the longitudinal ERW seam, specifically a manufacturing defect that evolved into a crack over time. Further investigations could not conclusively determine the cause of the crack’s growth during service.
The total volume of the commodity released was 18,400 barrels, though the exact amount that reached the surrounding environment has not been confirmed.
On December 7, 2022, during an in-line inspection tool run, the Liquids Pipeline Control Center received a leak detection alarm (volume imbalance) at 21:01 CST. This was followed by an emergency-line trip alarm at 21:07, prompting the controller to issue a shutdown command and isolate valves. Technicians were dispatched to various areas between the Steele City Pump Station and 30 miles downstream to confirm the release event. At 00:15 on December 8, a crude oil odor was detected by a TCE technician, confirming the release. The National Response Center (NRC) was notified at 00:28. Following the discovery, the pipeline was restarted on December 29 after the failed section was replaced. Mechanical and metallurgical testing are being conducted by an independent testing facility, and a root cause failure analysis (RCFA) is in progress.
The mechanical and metallurgical report, completed on March 8, 2023, determined that a lack of fusion on the inside diameter of the pipe caused stress concentrations, which initiated toe cracks that propagated to the outside diameter over time. Further updates from the RCFA, published on May 17, 2023, confirmed that the primary cause of the rupture was a progressive fatigue crack originating at a girth weld connecting a manufactured elbow fitting to the pipe constructed across Mill Creek. This girth weld transitioned the pipe wall thickness from the elbow fitting to the adjacent pipe joint. During installation, the pipe segment was subjected to inadvertent bending stresses sufficient to initiate a crack at a shallow lack of fusion feature in the girth weld. These bending stresses also led to deformation in the elbow fitting and a wrinkle in the adjacent pipe joint, creating a stress concentration point. Over time, this resulted in the initiation of a circumferential crack in the weld, which eventually caused the failure after 11.5 years of operation.
The estimated volume of commodity released was 12,937 barrels of crude oil, which was unintentionally discharged. Recovery efforts have been undertaken, and the estimated costs related to the release have been updated based on the ongoing analysis.
On December 5, 2016, the operator was notified by a landowner who had discovered oil on the property. Operator personnel immediately shut down the pipeline and initiated spill response actions. Upon arriving on site, personnel confirmed that the leak was from the company’s pipeline and took immediate steps to prevent further contamination by installing absorbent boom, boom, and earthen “underflow” dams. Efforts to remediate the soil contamination caused by the incident are ongoing.
Approximately 9,355 barrels of oil have been removed from the environment through various methods, including skimming, vacuuming, in-situ burning, and the excavation of contaminated soil. A report submitted by a third-party geotechnical professional engineer determined that the area of the failure was not safe for excavation of the failed portion of the pipeline. In response, Belle Fourche submitted a plan to excavate and replace a section of the pipeline with similar properties. This work was completed in mid-September 2017, and a metallurgical analysis of the specimen was conducted on October 11, 2017. Based on the metallurgical analysis and other company data, a root cause failure analysis (RCFA) was completed. The analysis concluded that the failure was caused by the pipeline being subjected to compressive and/or bending forces due to a landslide. The landslide itself was caused by excessive moisture in the hillside, resulting in unstable soil conditions.
The pipeline segment that failed remains shut down, and there are no plans to bring this portion of the pipeline back into service. The total barrels released to water is an estimate based on the number of barrels recovered from the water and the amount removed through in-situ burns. These figures are the best estimates available, but the actual total released may vary. The estimated release volume is 12,615 barrels.
The vast network of pipelines running throughout the United States provides essential energy to our homes and businesses, but as our analysis shows, this infrastructure comes with significant risks. Looking at over 7,000 incidents reported to federal authorities since 2011 reveals a concerning picture of pipeline failures that affect communities across the country. Our findings highlight how these risks vary geographically and by pipeline type. Texas experiences the most hazardous liquid incidents, while California leads in gas distribution failures. When assessing incidents on a county-level, Harris County, Texas, with its concentration of energy infrastructure, has reported over 400 hazardous liquid incidents alone, making it the nation’s most affected area.
Gas distribution incidents pose particular dangers to public safety, with more than one in five involving explosions. While the national average shows 20% of these incidents causing injuries, Texas faces an even higher rate of 30%. Hazardous liquid incidents present a different kind of threat. Though they cause fewer immediate injuries, about 13% contaminate water sources or harm wildlife, and these environmental incidents account for more than three-quarters of the total economic damage from all pipeline failures.
Looking at what causes these incidents points us toward solutions. Better excavation practices could significantly reduce gas distribution incidents, while improved corrosion management would help prevent many hazardous liquid failures. As we continue to rely on our aging pipeline infrastructure, this analysis makes clear the need for sustained improvement in safety practices, targeted investments, and stronger oversight. The costs, human, environmental, and economic, are simply too high to tolerate ongoing risks. Industry stakeholders, policymakers, and community leaders must work together to build a safer pipeline system that all Americans can depend on.
This analysis is based on incident data reported to the U.S. Department of Transportation’s Pipeline and Hazardous Materials Safety Administration (PHMSA) from January 2011 through February 2025. The dataset includes reportable incidents involving gas distribution, gas transmission, and hazardous liquid pipelines.
This analysis may be used for informational or educational purposes. When referencing our findings, please credit the original source with a clear link. Proper attribution ensures transparency and allows others to explore the full context behind the data.