
Available 24/7/365
Free Consultations
(800) 349-0000

The United States relies on an extensive network of pipelines that carry natural gases to all customers. Without this pipeline infrastructure, our economy would not be able to function. Every year, more than two million miles of main lines and pipelines deliver natural gases to over 70 million customers.
While this transportation network is mostly reliable and safe, recent pipeline explosions have called attention to its vulnerabilities. At the Doan Law Firm, we have witnessed the devastating impact of pipeline explosions on the public over time and recognize that many of the incidents could have been prevented through more effective safety measures by the companies.
Using the most recent data from the Pipeline and Hazardous Materials Safety Administration (PHMSA), we worked with the data visualization agency 1Point21 Interactive to analyze all pipeline explosions that occurred in the U.S. over the last decade. We included four types of pipelines: natural gas transmission and gathering, natural gas distribution, hazardous liquid and carbon dioxide, and liquified natural gas.
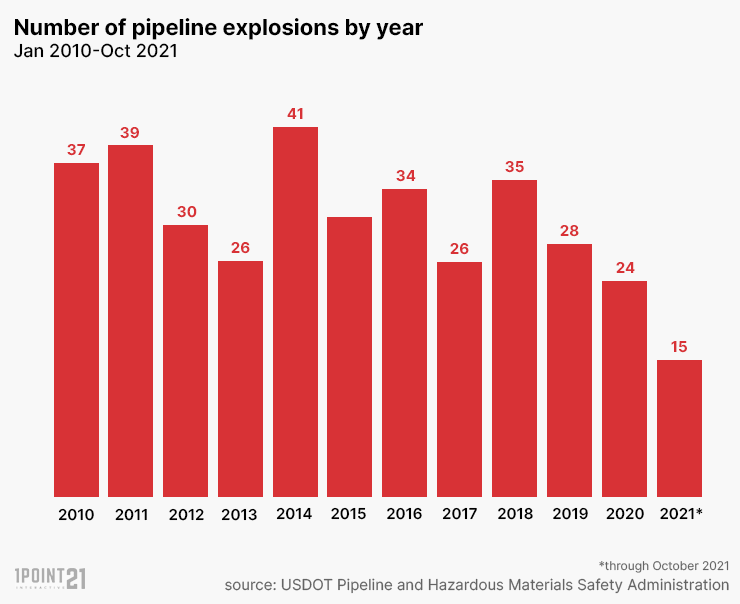
Between January 2010 and October 2021, there were 368 documented pipeline explosions, resulting in 89 deaths and 440 injuries.
Here are some of the biggest takeaways:
In 2014, the U.S. saw the highest number of pipeline explosions in the past decade: 41. Out of the 41 pipeline explosions, three incidents – located in New York, New Jersey, and Pennsylvania – resulted in deaths. New York’s 2014 East Harlem gas explosion is also the second-worst pipeline explosion in the U.S. by the number of casualties. It killed eight people and injured close to 50 people.
The East Harlem gas explosion was likely caused by a faulty connection between two Consolidated Edison Inc pipes, along with a hole in a nearby sewer line that New York City had been aware of for over eight years. The public and energy company’s delay in reporting the gas odor and notifying the fire department also made matters worse.
Both Con Edison and New York City’s infrastructure were found responsible for the pipeline explosion. In 2017, Con Edison settled to pay New York State $153.3 million over the deadly explosion – the state’s largest gas safety-related settlement. The settlement includes a $25.1 million fund that would cover the costs to fix gas pipes, improve responses to leaks, improve education, and compensate residents and businesses who were injured by the explosion.
| Year | Pipeline Explosions |
|---|---|
| 2010 | 37 |
| 2011 | 39 |
| 2012 | 30 |
| 2013 | 26 |
| 2014 | 41 |
| 2015 | 31 |
| 2016 | 34 |
| 2017 | 26 |
| 2018 | 35 |
| 2019 | 28 |
| 2020 | 24 |
| 2021 | 15 |
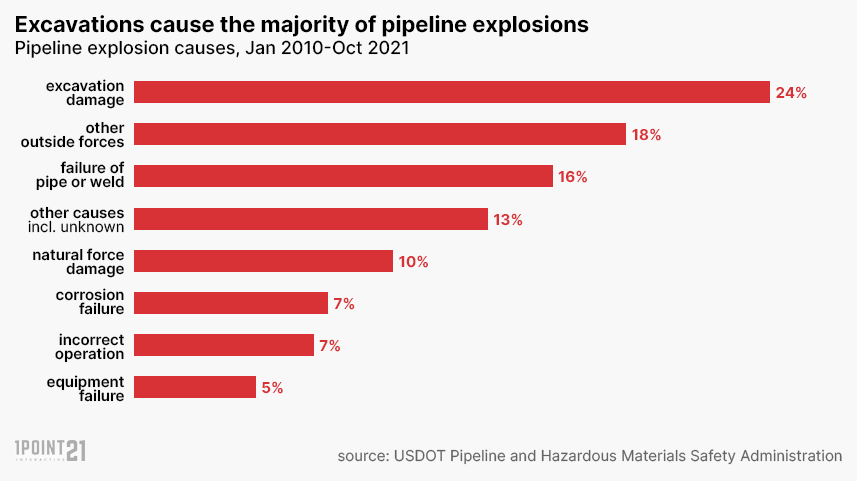
Excavations are the most common cause of pipeline explosions, accounting for 24 percent of explosions. In fact, excavations are nearly five times as likely to cause pipeline explosions than equipment failure and twice as likely than natural force damage.
| Cause | Number | Percent |
|---|---|---|
| Excavation Damage | 88 | 24 percent |
| Other Outside Force Damage | 68 | 18 percent |
| Material Failure of Pipe or Weld | 58 | 16 percent |
| Other Incident Cause | 49 | 13 percent |
| Natural Force Damage | 36 | 10 percent |
| Corrosion Failure | 27 | 7 percent |
| Incorrect Operation | 25 | 7 percent |
| Equipment Failure | 17 | 5 percent |
In addition, most of the pipeline explosions caused by excavations weren’t by the pipeline operator or their contractors but by a third party. 76 percent of excavation-related explosions involved a third party, compared to only ten percent that involved pipeline operators or contractors. The remainder of excavation-related explosions were caused by damage due to old excavations. The cause of five percent of explosions is unknown.
The majority of pipeline explosions (77 percent) come from distribution lines, which are the smaller, lower-pressure lines owned by local utilities.
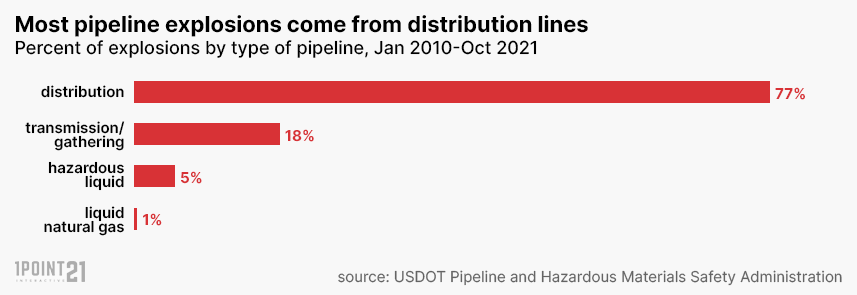
In the U.S., there are two million miles of natural gas distribution mains and pipelines – more than three times that of transmission/gathering and more than six times that of hazardous liquid pipelines. Main distribution lines move gas to industrial customers, while the smaller distribution lines feed to businesses and homes. Distribution lines are also more frequently found in urban areas that are more likely to experience disturbances like excavation, car crashes, and fires.
Distribution pipeline explosions occur more often, but transmission pipeline explosions are typically more deadly. On average, 1.8 people experience casualties in a transmission explosion, compared to 1.3 in a distribution pipeline explosion.
The three companies, Pacific Gas and Electric (PG&E), Consumers Energy, and Southern California Gas (SoCalGas), have experienced the most pipeline explosions in the past decade (12), but PG&E had the worst record with 83 casualties. Unsurprisingly, many of the companies on this list are some of the biggest natural gas operators in the country. In fact, SoCalGas and PG&E not only rank for the highest number of explosions but also as the top two public utilities by the number of customers.
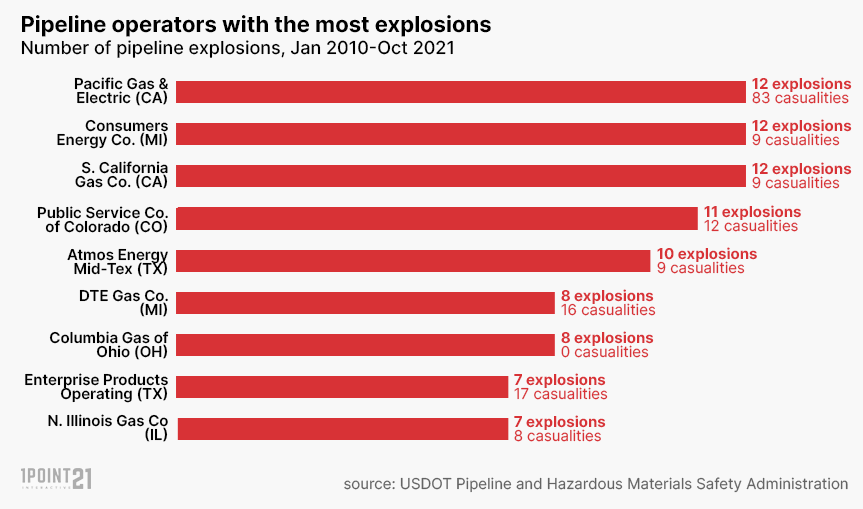
In some cases, the explosions were linked to a systematic violation of rules governing pipeline safety. Following the 2010 San Bruno explosion, which killed eight people and injured 58 people, an investigation found that PG&E falsified gas pipeline safety records from 2012 to 2017.
| Operator | Number of Explosions | Location of Explosion |
|---|---|---|
| Consumers Energy Co | 12 | Michigan |
| Pacific Gas & Electric Co | 12 | California |
| Southern California Gas Co | 12 | California |
| Public Service Co of Colorado | 11 | Colorado |
| Atmos Energy Corporation – Mid-Tex | 10 | Texas |
| Columbia Gas of Ohio Inc | 8 | Ohio |
| DTE Gas Company | 8 | Michigan |
| Northern Illinois Gas Co | 7 | Illinois |
| Enterprise Products Operating Llc | 7 | Texas |
| Atlanta Gas Light Co | 6 | Georgia |
| Consolidated Edison Co of New York | 6 | New York |
| Dominion Energy Ohio | 6 | Ohio |
| Indiana Gas Co Inc | 6 | Indiana |
| Public Service Electric & Gas Co | 6 | New Jersey |
| Baltimore Gas And Electric Company | 5 | Maryland |
| Niagara Mohawk Power Corp | 5 | New York |
| Black Hills Energy | 5 | South Dakota |
| Transcontinental Gas Pipe Line Company | 5 | Texas |
Surprisingly, pipeline explosions affect the general public more than pipeline workers, employees, and emergency responders. Members of the public are more than three times likely to get injured or to die by a pipeline explosion than a pipeline worker and ten times more than an emergency responder.
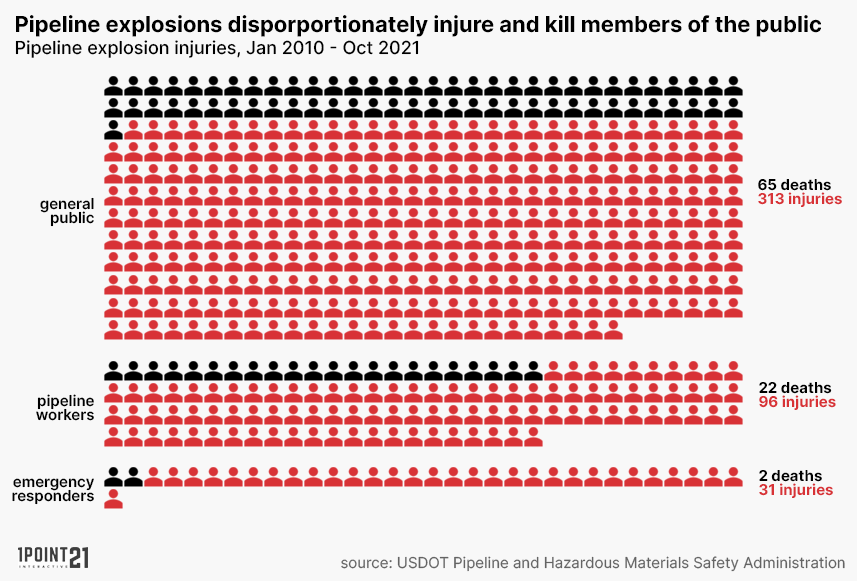
Between January 2010 to October 2021, 65 members of the general public (73 percent of all fatalities) were killed in a pipeline explosion, compared to 22 pipeline workers (25 percent) and two emergency responders (2 percent).
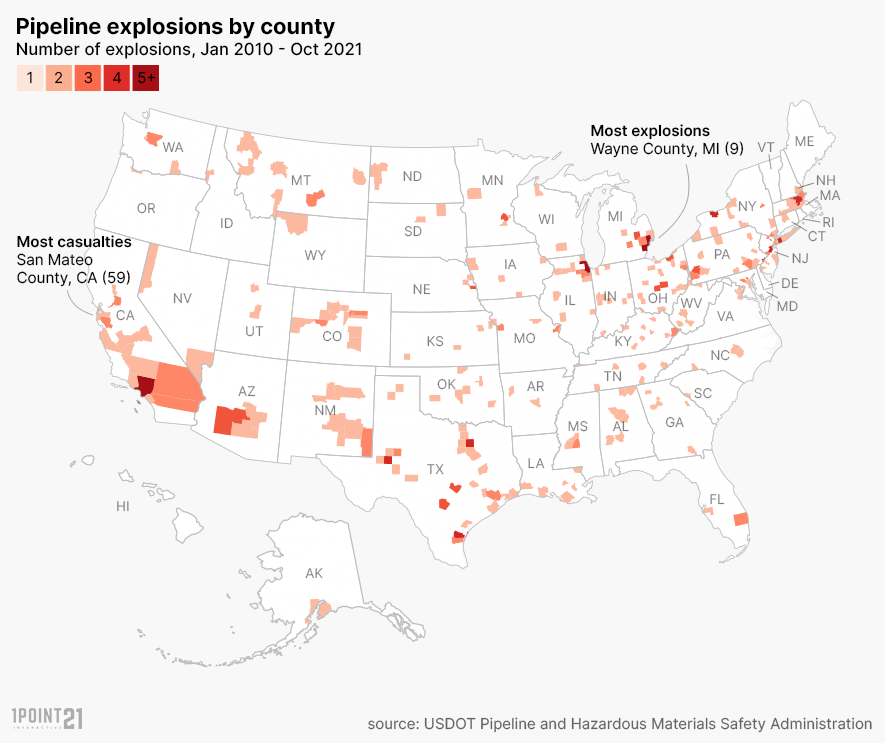
In the last decade, Wayne, Michigan saw more pipeline explosions (9) and casualties (20) than any other county, followed by Cook, Illinois, and Los Angeles, California.
Michigan has seen an increase in hazardous leaks in recent years due to the dangerous state of pipelines. While Michigan’s largest public utilities DTE Company and Consumer Energy have implemented programs to speed up the process of replacing aging pipelines, many people continue to face dangerous conditions right outside their homes and wait up to 25 years for a repair.
| County | State | Number of Explosions | Number of fatalities | Injuries | Total Casualties |
|---|---|---|---|---|---|
| Wayne | MI | 9 | 3 | 17 | 20 |
| Cook | IL | 8 | 0 | 10 | 10 |
| Los Angeles | CA | 5 | 1 | 2 | 3 |
| Macomb | MI | 5 | 0 | 0 | 0 |
| Middlesex | MA | 4 | 1 | 1 | 2 |
| Middlesex | NJ | 4 | 0 | 0 | 0 |
| Monroe | NY | 4 | 1 | 2 | 3 |
| Nassau | NY | 4 | 0 | 5 | 5 |
| Philadelphia | PA | 4 | 3 | 4 | 7 |
| Midland | TX | 4 | 1 | 4 | 5 |
| Dallas | TX | 4 | 2 | 1 | 3 |
| Nueces | TX | 4 | 0 | 11 | 11 |
San Mateo had only one explosion but the most number of casualties of all the counties. In 2010, a pipeline exploded in San Bruno, California, killing eight people, injuring 51 people, and destroying 38 homes in the area. The explosion was so large in size that at first, it was believed to be the result of a plane crash.
| County | State | Number of Explosions | Number of fatalities | Injuries | Total Casualties |
|---|---|---|---|---|---|
| San Mateo | CA | 1 | 8 | 51 | 59 |
| New York | NY | 3 | 8 | 49 | 57 |
| Essex | MA | 2 | 1 | 27 | 28 |
| Wayne | MI | 9 | 3 | 17 | 20 |
| Hampden | MA | 1 | 0 | 17 | 17 |
| Fresno | CA | 1 | 1 | 13 | 14 |
| Mercer | NJ | 2 | 1 | 10 | 11 |
| Nueces | TX | 4 | 0 | 11 | 11 |
| Cook | IL | 8 | 0 | 10 | 10 |
| Rockland | NY | 2 | 0 | 10 | 10 |
Location: San Bruno, California
Date: September 9, 2010
Casualties: 59
Fatalities: 8 (all to general public)
Injuries: 51 (all to general public)
Estimated Property Damage: $100,000
Summary: In 2010, a PG&E ruptured pipeline caused an explosion that killed eight people and injured 51 more in a San Bruno neighborhood. The explosion put the company and their aging pipelines under much scrutiny.
Location: New York City, New York
Date: March 12, 2014
Casualties: 56
Fatalities: 8 (all to general public)
Injuries: 48 (all to general public)
Estimated Prop Damage: $250,000
Summary: A number of gas safety violations by Con Ed allegedly caused the East Harlem building explosion, which killed eight people and injured 48 people.
Location: Lawrence, Massachusetts
Date: September 13, 2018
Casualties: 26
Fatalities: 1 (all to general public)
Injuries: 25 (all to general public)
Estimated Property Damage: $261,000,000
Summary: In 2018, the pressure in the gas pipelines was 12 times too high, resulting in a series of explosions and structure fires across Merrimack Valley. The event killed one teenager, injured 25 people, and impacted thousands of Columbia Gas customers. Columbia Gas paid $143 million to settle class action lawsuits brought on by explosion victims.
Location: Lawrence, MA
Date: Sep 13, 2018
Casualties: 26
Fatalities: 1 (all to general public)
Injuries: 25 (all to general public)
Estimated Property Damage: $261,000,000
Summary: After an overpressure gas line caused 80 fires, thousands of people were evacuated from their homes in Merrimack Valley. The explosion killed one person, injured 25 people, and destroyed or damaged over 100 buildings.
Location: Austin, PA
Date: Dec 12, 2016
Casualties: 0
Fatalities: 0
Injuries: 0
Estimated Property Damage: $64,000,000
Summary: An explosion and fire at Transco damaged some of the facility and station piping. An investigation by the PHMSA determined the root cause to be internal corrosion
Location: Plymouth, WA
Date: Mar 31, 2014
Casualties: 0
Fatalities: 0
Injuries: 1 (to pipeline employee)
Estimated Property Damage: $40,790,000
Summary: An explosion at the Plymouth LNG plant in eastern Washington injured five workers, forced hundreds to evacuate their homes, and resulted in significant property damage. This was one in several accidents that occurred at The Williams Companies’ natural gas facilities over three years. An investigation found that the company repeatedly failed to follow safety regulations and protect its employees not only at this facility, but throughout U.S.
While not all pipeline explosions can be prevented, many can be by improving company safety practices, maintaining pipeline integrity and better preparing the public for the incident. Companies should regularly inspect the pipelines for damage, monitor pressure in the lines, and train their employees on how to properly install pipelines.
As a member of the public, if you detect a leak or feel that something isn’t right, leave the area immediately and call 911 to report the leak.
According to the PMHSA, signs of a pipeline leak may include:
Our study is based on pipeline explosion data from the PHMSA over a decade. Our data includes four types of pipelines:
If you would like to report or republish our findings, please link to this page to provide a citation for our work.